 Home
HomeChapter 10 Images:
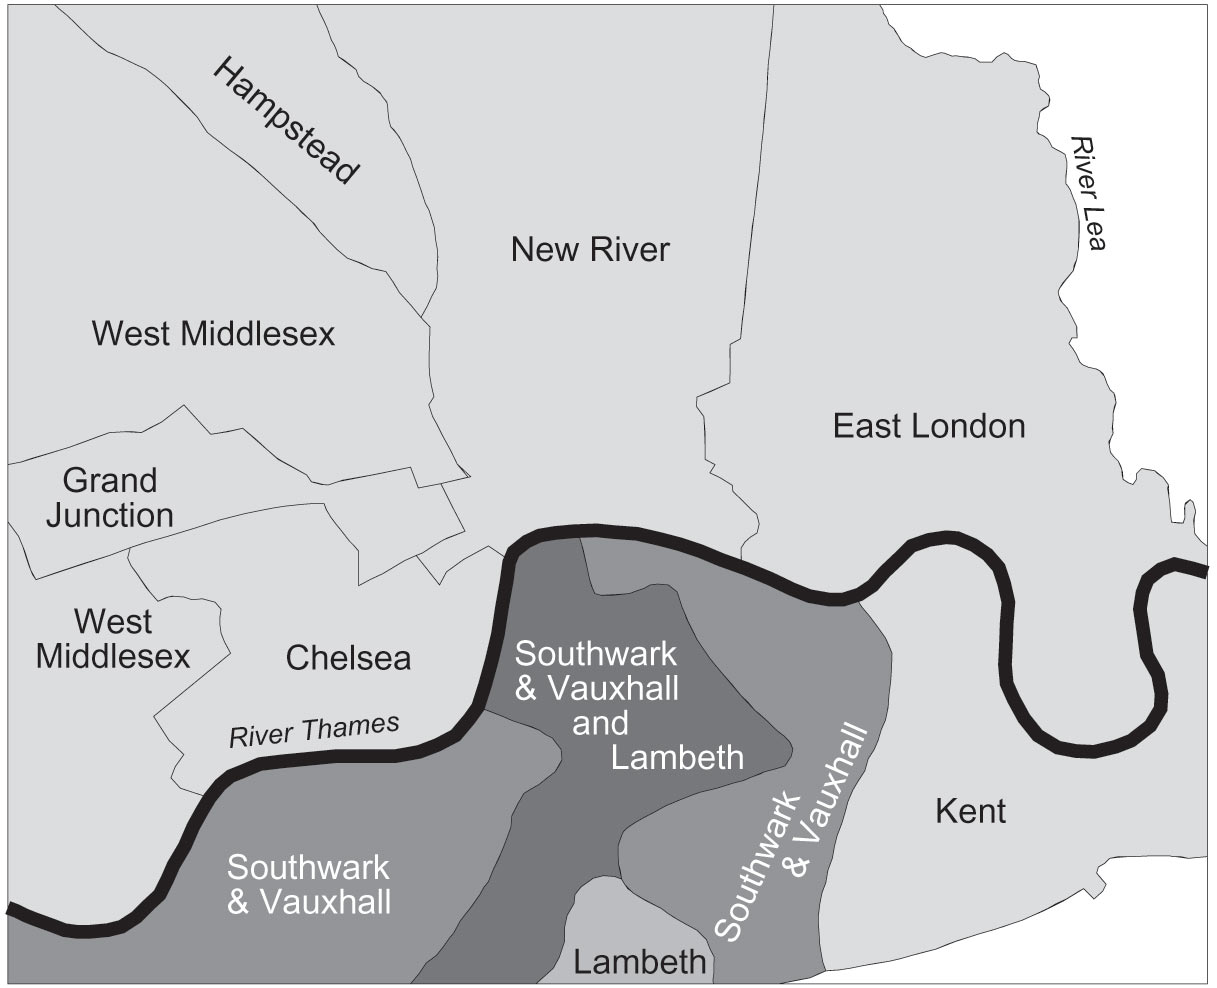 Figure 10.1. Map of metropolitan London showing River Thames and Lea, as well as the metropolitan districts served by various water companies.
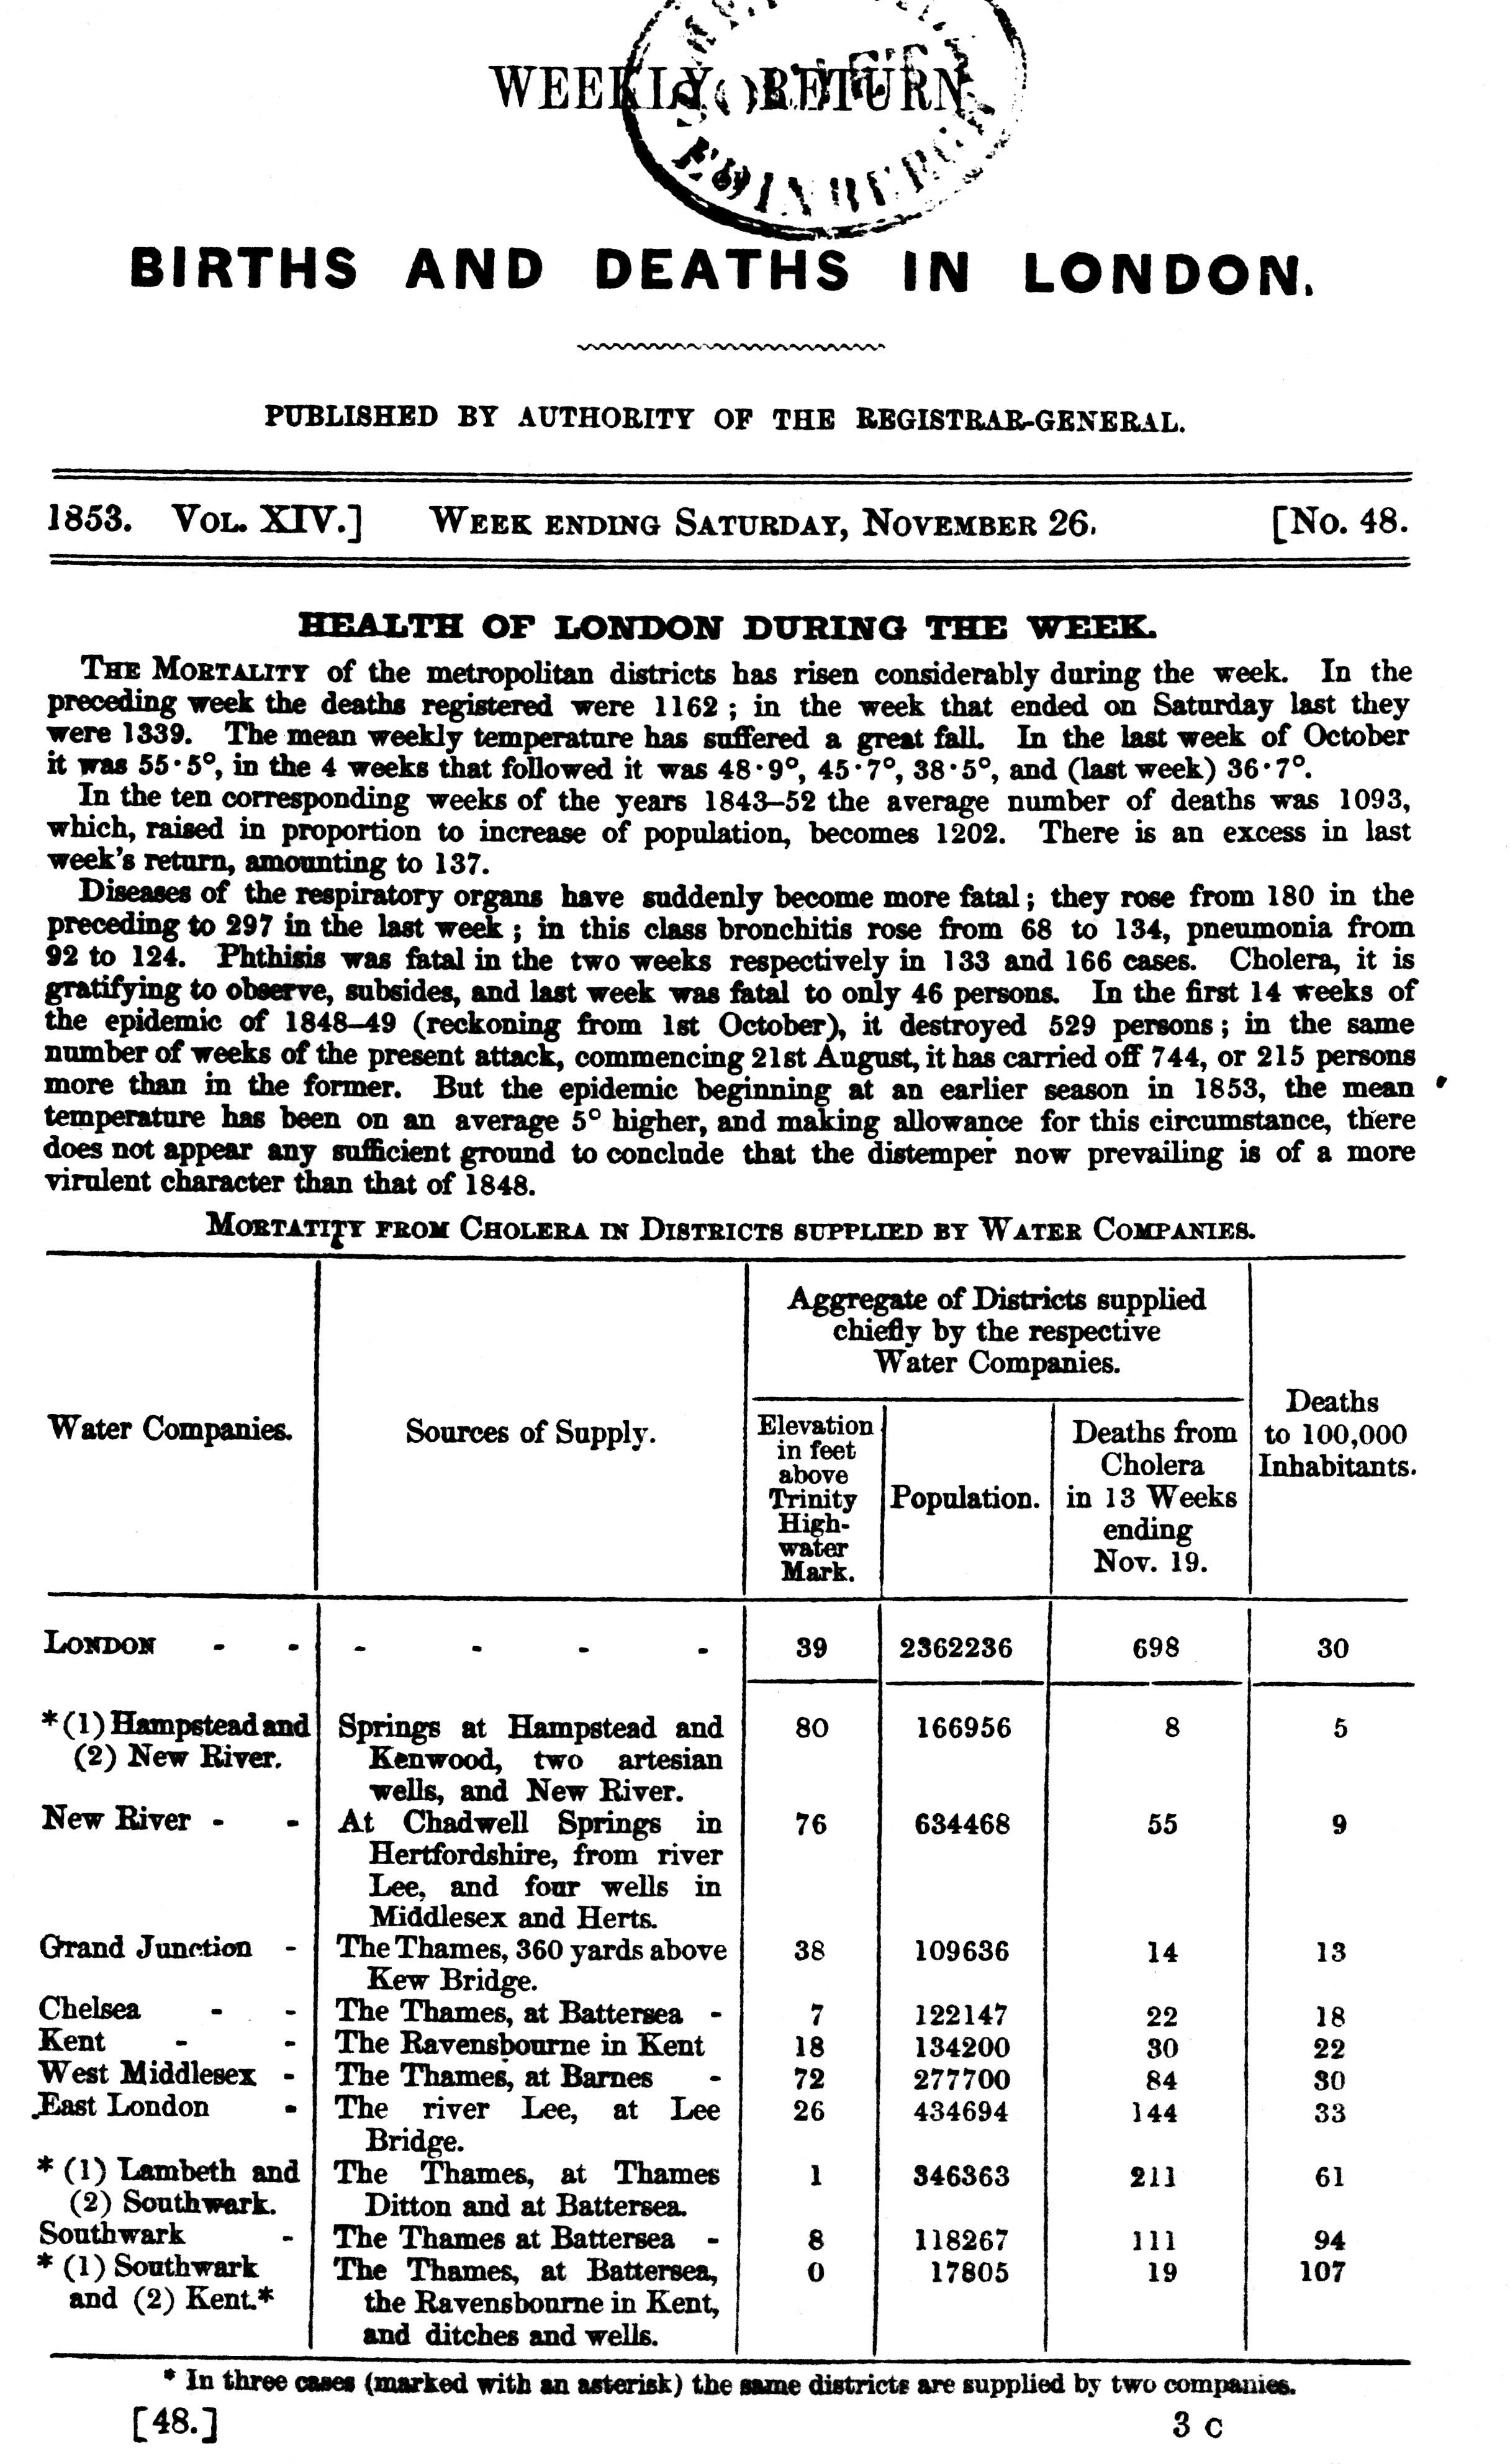 Figure 10.2. ( Weekly Return of Births and Deaths (26 November 1853).
 Figure 10.3. Cholera deaths in 1853 in south London organized by subdistricts (Snow, MCC2, 73, Table 6).
 Figure 10.4. Deaths from cholera in 1854 compared with calculated mortality (Snow, "Cholera and the water supply in the south districts of London," Table 6).
